Morris Lighting Tool

Indoor Tool Features

Indoor Layout Tool allows you to quickly estimate the light level (luminance), number of luminaires, and lighting layout, for a simple room or building.

How does it work?
  • When the Flash Tool opens, click on the desired input tab to open that section.
  • Typically for first time visits, go through the input sections top to bottom.
  • Once familiar with the tool operation, you can skip many of the input items and get results in seconds.
  • The tool will compute instantly when it has enough data.
Outdoor Tool Features

Outdoor Lighting Layout Tool generates simple templates and point-by-point lighting calculations. Now you can run continuous comparisons of different fixtures without the need for expensive photometry software.

How does it work?
  • When the Flash Tool opens, click on the desired input tab to open that section.
  • Typically for first time visits, go through the input sections top to bottom.
  • Once familiar with the tool operation, you can skip many of the input items and get results in seconds.
  • The tool will compute instantly when it has enough input.
INDOOR: Layout Tool
OUTDOOR: Layout Tool

Step 1:

Select a photometric file from the pull-down menu. The Indoor tool is designed to present only the photometric files that are relevant to the browser's location in the Morris website.

step 1 image

Step 1:

Select a photometric file from the pull-down menu. The Outdoor tool is designed to present only the photometric files that are relevant to the browser's location in the Morris website. Light Loss Factors and lumen proration are also possible from this section. The Luminaire Wattage is pulled from the IES photometric file this should be total connected load for accurate power density calculations.

step 1 image

Step 2:

The Geometry section will highlight the graphic model when a mouse over occurs for an input cell to help users differentiate dimensions.

step 2 image

Step 2:

To use as a simple template generator (one pole arrangement), set the arrangement from the pull down menu and leave the Layout and Spacing section blank. To use as a layout tool, select the Arrangement for the majority of your locations from the menu. If you want a uniform luminaire position (array) to begin, enter the Column and Row quantities and the spacing between. This is simply a starting point, as the layout is completely interactive. You can add different arrangements, change, move and manipulate aiming in any way from the graphics area using the mouse.

step 2 image

Step 3:

Reflectance is expressed in percent. The Coefficient of Utilization (CU) and effective cavity reflectance are computed and displayed.

step 3 image

Step 3:

Complete control over the luminance contour values (isoclines) is available from this section. All cells with checkmarks are included; set the values as desired. Click in the color cell to change the color if something else is preferred.

step 3 image

Step 4:

The Specify section is used to set the target Luminance level for the calculation. Options include the ability to compute based on a set number of luminaires, or for a target power density. The computation can be further constrained in terms of tolerance for the desired luminance level using the radio buttons.

step 4 image

Step 4:

The Display section is very important as it controls not only the appearance of the graphics area but how fast the tool computes and the number of point by point values visible. The Scale can be set in this section. However, interactive zooming changes the scale (fixed plot size). Interactively zoom using the mouse wheel or the Zoom indicator in the upper right corner of the graphics area. Panning is also possible by holding down the mouse wheel as you move.

step 4 image

Step 5:

This layout section provides constraints on luminaire position by Rows & Columns, Spacing, and Wall Spacing, Ceiling Grid or Continuous rows or columns. Select the checkbox to constrain and enter the desired setting for that parameter.

step 5 image

Step 5:

The statistics are normally computed on the area covered by the plot, which is controlled by the zoom level. If you want more specific statistics, set the coordinates of the statistical area here. Switch the statistical display on and off and select its contents from the Summary section.

step 5 image

Step 6:

This section allows some simple prorating for the calculations based on Lamp Lumens and Luminaire Wattage.

step 6 image

Step 6:

Set the preferred units

step 6 image

Step 7:

Set the preferred units.

step 7 image

Step 7:

The Output and Help section offers printing options and the ability to send email directly from here. The printed output consists of the graphics area containing the isocline contours and luminance values if enabled. The summary provides statistical information and luminaire location specifics. Each output section is a single page.

step 7 image

Step 8:

Preview, Print or Email your layout. Preview button to indicate “Project Title”, “Description”, “For” and “By”.

step 8 image

Step 8:

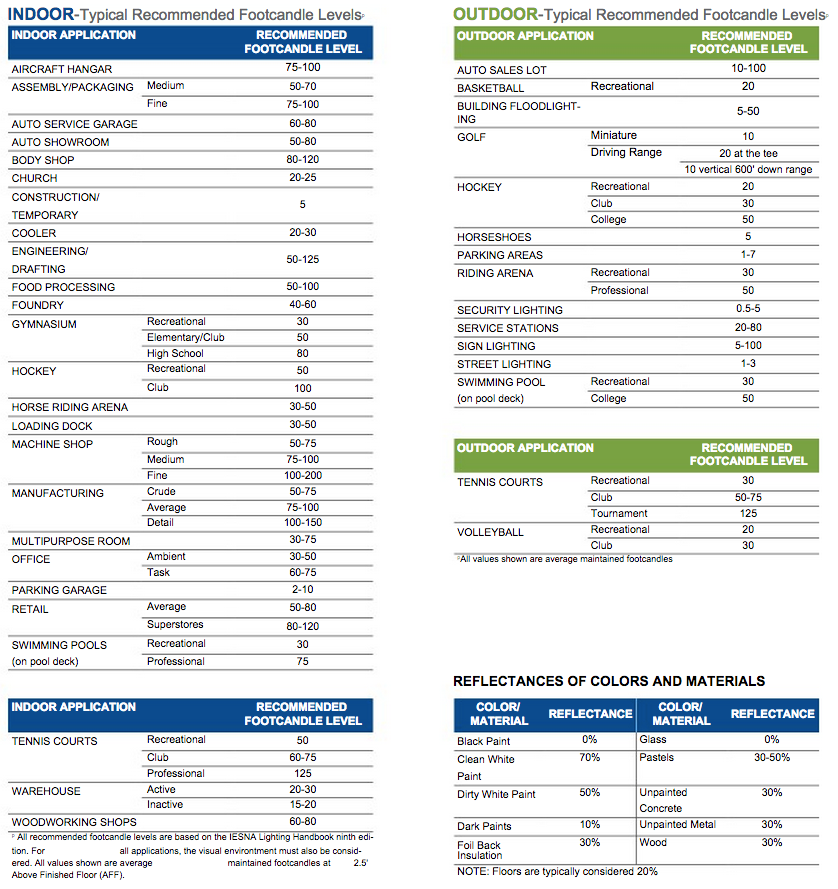
Unique interactive functionality:

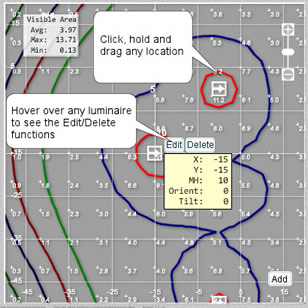
By clicking on the Add button in the lower right corner of the calculation area you can add a new luminaire arrangement to the plot area. Move any location by simply clicking and dragging. Hover over a location to display the Edit/Delete functions.

How-toImages/How-to 2

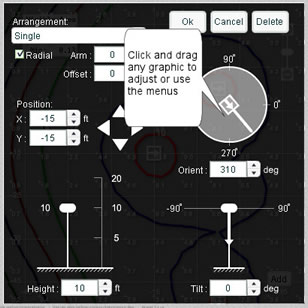
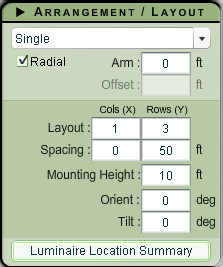
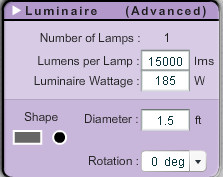
The Edit screen is shown here. You have complete control over luminaire aiming and positioning. The graphics are interactive so it's easy to just click and drag any graphic, or use the menus

Lighting Application Guidelines